
The queries that customers type in before clicking on one of your search engine marketing ads offer invaluable insight. Using the Google Analytics add-on for Google Sheets, we can create a regularly updating report that shows what users actually type into the search engine. Best of all, this report is available to anyone you give the URL to, and doesn’t require readers to have access to your Google Analytics account. We will add Goal Completions as a metric, so we can identify which search queries convert and which do not.
Finding Your Google Ads Search Queries
You can find customer search queries in both the Google Ads and Google Analytics consoles. These two are also the sources being used by third-party tools that import/export your data via API. We will be pulling this keyword data into Google Sheets to help improve reporting and help pull more meaning from the data by providing it in relevant context.
Google Ads Search Queries
When logged in to the Google Ads console, choose Keywords from the left panel, and then Search Terms from the horizontal menu just below the main menu bar. This view will show you a list of actual queries being typed into Google’s search bar by your clients. You can also access the view via this link.
Google Analytics Search Queries
The same data is available via Google Analytics, albeit with a slight time delay. When logged into the Google Analytics console, choose Acquisition from the left panel, select Google Ads and then Search Queries.

Google’s analytics add-on and paid third-party options
Google and Third-Party Reporting and Import Tools
You don’t need to pay anything to import your data from Google Analytics into a Google Sheets spreadsheet. Google provides a dedicated and supported add-on for Google Sheets. It is not the most intuitive piece of software ever written, but it’ll do in a pinch. The most popular third-party tool is Supermetrics, which offers broad multi-channel support. Pricing is a significant concern, as the Free/Hobby tier is essentially useless, and the next tier at $99 limits your refreshing ability to once per week. There are a handful of competitors like DigiXport, but all have their limitations and risks. Unless you’re pulling in data from multiple sources on a regular basis and need Supermetrics, the Google Analytics add-on should be more than enough.
Install the Google Analytics Add-On
Installing add-ons to Google Sheets is a breeze. Simply open up a blank spreadsheet, navigate to add-ons from the main menu, and select get add-ons. Search the G-Suite marketplace for “google analytics”, and download/install the official app. You will need to provide authorization for the app and have access to the Google Analytics data of the website you want to report on.
Create a Search Query Report in Google Sheets
With the add-on installed, we’re now ready to set up our report. When finished, we’ll be able to see a list of the Google Ads search queries that customers typed in before clicking our ads. We can also sort and filter as needed, as well as add additional metrics like keyword, device type, campaign or ad group name. To get started, navigate to add-ons from the main menu, select Google Analytics, and Create New Report.
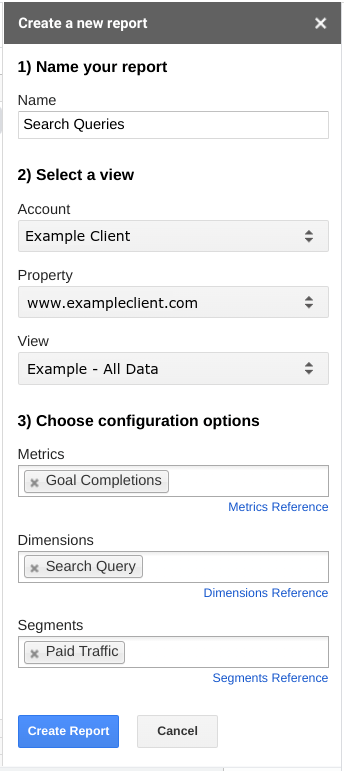 You will now see the following sidebar on the right of your screen:
Unfortunately, there is no way to get back to this wizard once you create your report, but you can still edit them so no worries. If you do make a mistake, simply delete the report and settings sheet and start over.
Setting up a Google Analytics Add-on Report
- Name your report: This will be the name of the sheet on which the report is generated. In this case, we’re creating a report about search queries, and will name it as such.
- Select a view: Choose the view in Analytics you want to pull data from. Make sure this view has the relevant data and goals you want to report on. When in doubt, just select an “All Data” or otherwise broadly encompassing view.
- Choose configuration options: Here is where we select what data will be shown in the report. For the purposes of this simple example, we will only be using:
- Metrics: Goal Completions
- Dimensions: Search Query
- Segments: Paid Traffic
We choose the paid traffic segment, as search queries from sources other than Google Ads will show up as (not set) if at all. You can glean additional insights about organic search queries through the Google Search Console.
You have a comprehensive choice of metrics and dimensions that you can use to generate your reports, but remember that once you create your report you’ll lose access to the wizard and will have to manually add/remove metrics. Visit the Dimensions & Metrics Explorer and Segments Feature Reference from Google to see all your options.
This add-on uses the Google Analytics Reporting API v4 as of January 2019. Don’t get frustrated when trying out this tool, especially when building larger and more complex reports. Not all metrics and dimensions can be queried together, and you’ll likely resort to trial and error to get the data combinations that you need.
Editing an Existing Google Analytics Sheets Report
Once you click create report, the Google Analytics add-on will generate a new sheet with named “Report Configuration”. Despite the button claiming to create your report, there is still some work to be done. Did you set a time range, for example? Unfortunately, the setup wizard here is incomplete (and likely why you can’t bring it back up again anyway). All the configuration options can be edited freely, though you won’t know if your changes work until you actually generate the report later.
Start and End Date Settings
The most likely change you’ll be making to this template report will be the date range. By default, the date range will be from 30 days ago to yesterday. You’ll see these two values in the Configuration Options under Start Date and End Date. Google explains how to make simple adjustments for start date:
The start date for fetching Analytics data. Requests can specify a start date formatted as YYYY-MM-DD, or as a relative date (e.g.,
today,yesterday, orNdaysAgowhere N is a positive integer).
And similarly for end date:
The end date for fetching Analytics data. Requests can specify an end date formatted as YYYY-MM-DD, or as a relative date (e.g.,
today,yesterday, orNdaysAgowhere N is a positive integer).
Order and Filters
You can order your results based on available metrics, in this case we’ll order by goal completions. Choose whether to sort via ascending or descending by adding a subtraction symbol (as shown below) or not:
-ga.goalCompletionsAll
Furthermore, you can also filter your results. If we only want to show converting queries (and ignore those queries that did not fire a goal), we enter the following:
ga.goalCompletionsAll>0
Orders and filters can be customized as needed using simple operators or increasingly complex statements.

Data without contextual visualization is meaningless
Outputting your Report Results and Scheduling Refreshes
Once you’re satisfied that the report covers your needs, you’re ready to generate your results. Navigate to add-ons from the top menu, select Google Analytics and Run Reports. If you have multiple reports, they can all be run simultaneously. The tool will create a new sheet with the same name as your Report Name in the configuration settings. Did everything work out as expected? Let us know in the comments if you have any problems.
Scheduling Google Ads and Analytics Reports in Sheets
You don’t want to be manually refreshing the reports you worked so hard on building, do you? Third party tools that offer data import for free will still typically put up a paywall when it comes to scheduling. No such problems from Google, however.
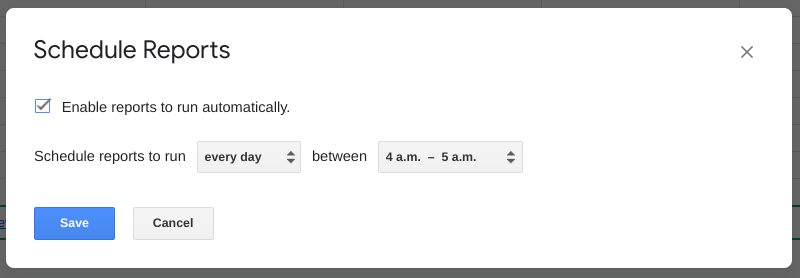
Navigate to add-ons, then Google Analytics and Schedule Reports. The window above will show up. Simply check that you want to enable reports to run automatically, and choose your frequency.
Next Steps and Conclusions
You’ve got the data coming in, and that’s great. But now what? You can share the page with others, including clients, using the share button at the top right. Consider how much access you would like to give people, and whether to limit it to specific e-mail addresses, or anyone who has access to your link URL.
Finally, when creating reports for paying clients, you’ll want to further clean up these reports and create an intuitive and easy-to-understand dashboard. Each client will have different requirements and KPIs, but the Google Analytics add-on for Google Sheets is a free and powerful tool to help you create informative, automated reports and dashboards for yourself and your clients.